Research · Statistics & machine learning
Predicting NBA Rookie Fantasy Production and Evaluating Preseason Prices
A Retrospective Study of the 2010–2025 Draft Classes
Abstract
This study separates forecasting first-season NBA fantasy production from identifying value relative to fantasy draft prices. A retrospective pipeline retained 894 official picks from 2010–2024, used 819 verified first-season outcomes for training, and evaluated a frozen model on all 59 picks in the 2025 class. A histogram gradient-boosting model achieved a mean absolute error of 404.2 adjusted fantasy points, versus 447.4 for a draft-position baseline. The paired difference was −43.2 points (95% player-bootstrap interval, −105.8 to +23.6), leaving the advantage unresolved. Among 19 rookies with verified preseason ESPN average draft positions, nine finished above their fantasy draft position; mean production surplus against a prior-season rank-to-points benchmark was −216.7 (−567.8 to +119.4). Historical price recovery yielded 138 priced rookies across ten classes. None of 96 exploratory trait comparisons survived Benjamini–Hochberg correction (minimum adjusted p-value, 0.240). A later model using NBA draft position and college assists produced a small, uncertain error reduction and is explicitly posthoc. Selective price coverage, a possible draft-length effect near pick 140, retrospective team reconstruction, and a documented parser-isolation incident constrain interpretation. These results do not establish systematic rookie underpricing or a reliable draft-day bargain rule. They motivate prospective validation with dated role information and verified market prices.
Keywords: NBA draft; fantasy basketball; average draft position; retrospective validation; gradient boosting; multiple testing.
Introduction
A productive NBA rookie is not necessarily a good fantasy draft purchase. Production depends on talent, playing time, availability, and scoring rules. Value also depends on the price paid. Confusing those questions can turn a useful ranking model into an unsupported claim about market inefficiency. This study therefore evaluates production forecasts separately from returns relative to observed fantasy average draft position (ADP). NBA draft position measures selection pedigree; it never substitutes for a fantasy price.
Three questions organize the analysis. First, do college, combine, and contextual features improve first-season production forecasts over NBA draft position alone? Second, did the priced members of the 2025 draft class outperform a transparent ESPN ADP benchmark? Third, do any draft-day traits consistently identify better returns in historical priced cohorts? An interpretable two-predictor follow-up examines how much college assists add to a simple log-pick model, but it does not supply a fresh test of the third question.
The methodological contribution is an auditable separation of these estimands, including missing observations, source corrections, and inconclusive comparisons. The models use established regularization and boosting methods [5] [6] [7]. The design follows the principle that model selection and performance estimation must be distinguished [8]. It makes no claim of a novel forecasting algorithm, causal identification, or a validated trading strategy.
All analysis was conducted retrospectively in October 2026. The original specification was frozen on October 1, 2026 in New York (October 2 UTC), before the authorized collection and evaluation of 2025-class outcomes, rather than before the 2025–26 season occurred. Accordingly, this is a retrospective frozen-model evaluation, not a live preseason forecast or a prospectively registered study. The audit also records an earlier incidental parser access to ancillary outcome cells, discussed below. Later price and feature analyses were conducted after the class outcomes had been seen.
Data, cohort definition, and source provenance
Draft-class population and outcomes
Official NBA DraftHistory identities define the population [2]. The development set contains all 894 picks from 2010–2024: 60 picks per class through 2021 and 58 in each of 2022–2024. Of these, 819 have verified first-season targets and 75 remain unknown. Unknown targets are excluded from fitting, never imputed or assigned zero. Seventy-three of the 75 unknowns are second-round picks; the 2015 class has only 45 observed targets. This concentration can bias evaluation toward easier-to-observe players.
The evaluation set contains all 59 official picks in the 2025 class, with complete verified outcomes, including four nonparticipants assigned zero only after checks against the official NBA player population. The saved 2025–26 league scoring table contains 582 participants. The cohort concerns production in the NBA season immediately following the draft, not every player officially eligible for a Rookie of the Year award. Undrafted players and production from a later debut season are outside this first-season outcome definition. A player's absence from an incomplete source is insufficient evidence of nonparticipation.
NBA identities and season totals are combined with basketball and college reference records, combine measurements, recruiting ranks, and team standings. Identity crosswalks retain verified aliases and draft-trade evidence. Collection manifests preserve source URLs and hashes. No new outcomes were acquired and no statistical models were fitted for the preparation of this paper; the manuscript reports the saved research artifacts.
Predictor timing and missingness
The original model declares 68 feature fields spanning NBA pick, age, pathway, college production and efficiency, recruiting history, physical measurements, and team context. A temporal guard masks undated historical listed measurements and substitutes verified combine positions. It masked 2,930 mutable historical cells. Raw observations remain unchanged, and learned imputation occurs only within fitting folds. Market fields and NBA outcomes are excluded from the predictor allowlist.
These controls do not establish contemporaneous provenance for every feature. In particular, historical landing teams are reconstructed from the first team observed in the draft-year NBA season, while the 2025 test uses the drafting team as a preseason proxy. The historical assignment could reflect roster decisions made during the season, and draft-day trades can make the test proxy inaccurate. This temporal limitation and train–test mismatch apply to the original contextual models. The later pick-and-assists model does not use team fields. The original estimates are preserved rather than silently revised.
Preseason fantasy prices
The principal 2025 market sample uses the ESPN column in a Hashtag Basketball table updated October 7 and archived October 9, 2025 [3]. It contains 19 verified rookies. The other 40 remain unpriced. Editorial rankings, projections, other providers' prices, and NBA draft order do not fill those gaps. The historical expansion retains all 953 official picks from 2010–2025 and recovers 138 actual ESPN average picks across ten classes. Legacy ESPN tables explicitly label the field AVG PICK [4]; modern observations use archived Hashtag ESPN average picks.
| Class | Prices | As-of date | Source |
|---|---|---|---|
| 2010 | 7 | 2010-10-05 | ESPN AVG PICK |
| 2013 | 15 | 2013-10-14 | ESPN AVG PICK |
| 2014 | 13 | 2014-10-23 | ESPN AVG PICK |
| 2015 | 12 | 2015-10-26 | ESPN AVG PICK |
| 2016 | 9 | 2016-10-16 | ESPN AVG PICK |
| 2017 | 18 | 2017-10-16 | ESPN AVG PICK |
| 2021 | 10 | 2021-10-18 | Hashtag ESPN |
| 2022 | 17 | 2022-10-05 | Hashtag ESPN |
| 2023 | 18 | 2023-10-03 | Hashtag ESPN |
| 2025 | 19 | 2025-10-07 | Hashtag ESPN |
| Total | 138 | 10 classes |
No qualifying prices were recovered for 2011, 2012, 2018, 2019, 2020, or 2024. The 2010 and 2013 captures are early preseason exceptions, 21 and 15 days before opening night. The 2021 capture occurred on opening day before the first game and describes an October 18 update. All accepted captures precede play, but their distances from opening night differ. Underlying draft counts, pooling across points and category leagues, and treatment of undrafted players remain unverified. Repeated values near picks 139–140.4 motivate a sensitivity subset with ADP below 139; that threshold does not certify an uncensored market.
Methods
Scoring and normalization
For production forecasting, current ESPN default points weights are applied consistently to historical box scores. Let F denote a player's season total under the modern rule [1]:
The adjusted target rescales each season by the mean production of its top 150 scorers. For season t, let Sₜ be that mean and let Sref = 2290.4333, the frozen 2024–25 reference. Then:
For 2025–26, Sₜ = 2246.64. Adjusted points describe production relative to a common scoring environment; they are not literal fantasy points earned. The realized test-season scale is used to evaluate the target, not as a predictor. Converting a prediction back into native 2025–26 units therefore requires an ex-post quantity and should not be represented as a preseason-known forecast of raw points. Season totals also differ from fantasy playoff windows and weekly roster usefulness.
Historical price analyses use scoring appropriate to each era rather than retrospectively interpreting old prices under new weights. The legacy formula is PTS − FGA + FGM − FTA + FTM + REB + AST + STL + BLK − TOV. ESPN changed its default formula in 2020 [1]. Available legacy priced classes are 2010 and 2013–2017; available modern priced classes are 2021, 2022, 2023, and 2025. This era separation does not verify the scoring settings of every underlying ADP draft.
Production models and validation
Four candidates were compared. M0 is ridge regression on a quadratic spline of log NBA pick (four knots). M1 adds age, prior-season team winning percentage, and a categorical team field. M2 is elastic net on all allowed features. M3 is histogram gradient boosting on all allowed features. Numeric preprocessing includes fold-fitted median imputation and missingness indicators, with standardization for linear candidates. Categorical preprocessing uses a missing category and dense one-hot encoding, with infrequent-category grouping at five observations. M3 uses median imputation without scaling to preserve entirely missing columns in the installed runtime.
The outer validation leaves out one complete draft class at a time, producing 15 folds. Within each outer training set, three class-grouped folds tune a fixed small grid by equally weighted mean within-class Spearman correlation. No validation-class observations enter preprocessing or fitting for their fold. A one-standard-error selection rule prefers M0, then M1, M2, and M3 among qualifying candidates. M3 was the only candidate above the acceptance threshold of 0.6040 and was refitted on all 819 observed training outcomes. Its selected settings were seven leaf nodes, L2 regularization zero, learning rate 0.06, 100 iterations, and minimum leaf size 25.
Nested tuning limits hyperparameter leakage, but choosing a candidate using the same outer-fold summaries still creates selected-model optimism [8]. Further, leave-one-class-out training can include classes later than the validation class; it is a grouped retrospective evaluation, not a rolling historical forecasting simulation. The 2025 class remains later than every development class. Model specifications, training fingerprints, and predictions were saved before the main test outcome acquisition, and the original model was not changed after that evaluation.
Test metrics include mean absolute error (MAE) in adjusted points and Spearman rank correlation; Spearman was the predeclared primary model-selection metric. Paired differences resample identical player indices for both models. The original report uses 500 seeded percentile-bootstrap draws; its exact saved intervals are retained [9]. This modest resampling count introduces Monte Carlo variability at the interval endpoints. Player resampling conditions on a single class and fixed fitted models; it does not include training uncertainty, common class shocks, or future-class variability.
Nominal 80% prediction bands use fixed draft-pick tiers (1–5, 6–14, 15–30, and 31–60). A separate diagnostic reserves three classes for calibration within each outer training set. The deployed full-training refit instead uses approximate out-of-fold absolute-residual radii. Those bands are not exact split-conformal intervals for the final estimator and have no universal finite-sample coverage guarantee.
Returns relative to fantasy price
Let Aᵢₜ denote ESPN fantasy ADP and Rᵢₜ the final league-wide fantasy rank under the relevant era's scoring, with average ranks for ties. Rank gain is Gᵢₜ = Aᵢₜ − Rᵢₜ. Positive values mean finishing ahead of ADP. A second outcome uses the prior season's observed rank-to-points curve Bₜ₋₁, smoothed by a centered nine-rank mean and interpolated without extrapolation. Normalized production surplus is:
Both sides of a historical comparison use the evaluated class's scoring formula. For the 2025 class, the benchmark uses the fixed 2024–25 curve. This is an explicit price-to-production benchmark, not a calibrated estimate of market expectations. The 2010 class has rank gains but lacks FP surplus because the 2009 league table is unavailable; thus 138 prices supply 131 surplus pairs.
The exploratory 2025 price test reports 20,000 player-bootstrap draws. A one-sided sign-flip test targets positive surplus and assumes independent, zero-centered, sign-symmetric surpluses, a stronger null than zero mean. A separate one-sided exact binomial test evaluates a rank beat rate above 50%, excluding ties. The original plan applied Holm correction to four tests across two source samples. One source sample was subsequently withdrawn for unverified price semantics; its inferential results are not used in this paper. The valid primary sample's unadjusted tests already fail to support positive return, and the original conservative adjusted values are retained only in the audit.
Historical trait screen and posthoc follow-up
The historical screen comprises 12 traits × two outcomes × two scoring eras × two price subsets, for 96 comparisons. Traits include age, college seasons, college BPM, true shooting and three-point percentages, assists, rebounds, steals and blocks per 40 minutes, wingspan minus height, prior-team winning percentage, and NBA draft position. Each test average-ranks feature and outcome on complete cases, centers their ranks within class, and correlates those residuals. Ten thousand seeded permutations shuffle target residuals within class. Two-sided Monte Carlo p-values use (1 + extreme draws)/(10000 + 1) [11]. All 96 tests were estimable and entered Benjamini–Hochberg adjustment [10]. Conditional exchangeability within class and independence or appropriate positive dependence across tests are assumptions, not established properties of these data.
The entire historical expansion is exploratory: the 2025 outcomes were already known when the plan was saved. A later ridge model uses only log NBA pick and final pre-draft college assists per 40 minutes. Its alpha is chosen from 0.1, 1, 10, 100, and 1000 by equally weighted class MAE in leave-one-class-out validation. Each fold learns imputation and standardization. Final alpha is 0.1 for both the two-predictor model and its same-family pick-only comparator. College assists are observed for 689 of 819 training targets and 47 of 59 test players; missing values use the training median of 2.679, without adding a missingness indicator to this two-feature model. Those choices were made after seeing 2025 outcomes, so training-only fitting does not restore an untouched holdout.
Results
Frozen production evaluation
| Model | Dev. MAE | Dev. ρ | 2025 MAE | 2025 ρ |
|---|---|---|---|---|
| M0: pick spline + ridge | 400.0 | 0.596 | 447.4 | 0.550 |
| M1: pick + context | 399.7 | 0.587 | — | — |
| M2: elastic net | 490.3 | 0.601 | — | — |
| M3: gradient boosting | 381.1 | 0.627 | 404.2 | 0.583 |
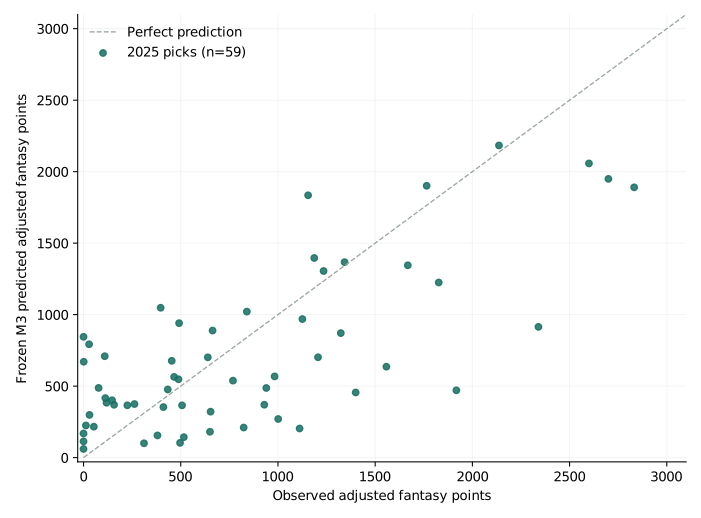
M3's 2025 MAE was 404.2 (95% interval, 323.2–486.7), compared with 447.4 (349.0–541.2) for M0. The paired M3-minus-M0 error difference was −43.2 (−105.8 to +23.6). Spearman correlation was 0.583 (0.376–0.736) for M3 and 0.550 (0.301–0.733) for M0; the paired difference was +0.032 (−0.094 to +0.161). Both comparison intervals include zero. The estimates favor M3 within this class, but they do not resolve a predictive advantage or establish equivalence. Both models' nominal 80% bands covered 44 of 59 observations (74.6%).
Draft position dominates the selected model's descriptive permutation importance: mean Spearman loss was 0.473 when pick was permuted, compared with 0.034 for prior-team winning percentage. These are post-selection diagnostics across development classes. Correlated predictors can share importance, and the team variable carries the reconstruction limitation described above. Importance is not a causal effect or a measure of fantasy price inefficiency.
The 2025 fantasy price comparison
Nine of the 19 priced rookies finished above their ESPN ADP (47.4%; 95% Wilson interval, 27.3%–68.3%). There were no rank ties. Mean adjusted FP surplus was −216.7 (95% bootstrap interval, −567.8 to +119.4), and median surplus was −62.1. Mean rank gain was −71.2 (−142.9 to −8.8). These different summaries are not interchangeable: rank changes need not have equal production value, and a count of winners ignores the magnitude of gains and losses.
The one-sided sign-flip p-value for positive FP surplus was 0.8783; the one-sided rank-majority p-value was 0.6762. These results do not support average underpricing in this selected sample. The negative rank-gain interval describes poor rank returns among observed players under the specified benchmark; it does not establish a general rookie premium. Forty rookies lack prices, near-tail ADPs may not describe active drafting, and no matched-veteran comparison separates rookie-specific pricing from market-wide calibration.
Historical returns and trait comparisons
| Era / sample | Prices | FP pairs | Beat FP | Mean surplus |
|---|---|---|---|---|
| Legacy, all | 74 | 67 | 9/67 | −658.4 |
| Legacy, ADP < 139 | 46 | 41 | 8/41 | −620.7 |
| Modern, all | 64 | 64 | 25/64 | −337.0 |
| Modern, ADP < 139 | 21 | 21 | 14/21 | +86.2 |
No trait survived correction across the 96 comparisons; the minimum BH-adjusted p-value was 0.240. The strongest tentative modern association was NBA pedigree: the class-adjusted correlation between numeric NBA pick and rank gain was −0.371 (unadjusted p = 0.0032; adjusted p = 0.240; n = 64). All four modern classes had the same negative direction. Restricting prices to ADP below 139 weakened the association to −0.143 (p = 0.578; n = 21), with three class directions reversing. College shooting percentages, BPM, assists, rebounds, defensive box-score rates, age, experience, and relative wingspan supplied no corrected bargain signal.
Modern FP-benchmark winners played a mean 73.1 games and 29.0 minutes per game, versus 52.0 games and 19.4 minutes for nonwinners. Per-game nonwinner averages exclude one nonparticipant. Such differences are hindsight descriptions: season totals mechanically depend on games and minutes, and the grouping was defined using those totals. They cannot validate a preseason opportunity forecast. The modern ADP-below-139 subset had a 14/21 FP win rate but only +0.8 mean rank gain, illustrating why frequent modest wins need not imply large average gains.
Two-predictor exploratory model
The final combined ridge fit, expressed in adjusted FP with missing assists replaced by the training median, is:
Across all 59 players, the combined model had MAE 430.6 and Spearman 0.568, compared with 442.5 and 0.550 for its same-family pick-only comparator. This comparator is distinct from the original spline-based M0. The combined-minus-pick-only difference was −11.9 MAE (10,000-draw 95% paired interval, −26.3 to +2.4) and +0.017 Spearman (−0.043 to +0.081). The combined model's average prediction-minus-outcome bias was −211.5 points. Among the 47 players with observed college assists, its MAE was 458.2 versus 472.3. The full 59-player population remains primary. Neither interval resolves an advantage, and the posthoc predictor choice prevents an independent confirmatory interpretation. The assists coefficient is conditional on pick in this fitted model, not a causal passing effect.
![Two horizontal confidence intervals for model-minus-baseline error: minus 43.2 [minus 105.8, plus 23.6] and minus 11.9 [minus 26.3, plus 2.4].](paired-errors.svg)
Source corrections and research integrity
An earlier market supplement treated archived FantasyPros provider columns as literal mean draft picks. A subsequent full-table audit found integer ordering structure: the 2025 ESPN column contains 199 unique integers spanning 1–200, and the Yahoo column 255 spanning 1–256. Literal average-pick semantics could not be verified. Consequently, price-to-FP conversions, surplus magnitudes, market MAE comparisons, and the 13-player direct ESPN sensitivity based on those columns were withdrawn from actual-price inference. Original files remain retained as superseded artifacts. The all-59 frozen production test and the Hashtag 19-player primary price result are unaffected. Ordinal rankings may support a separately labeled rank comparison, but not numerical price conversion.
During initial recruiting-table extraction, a generic parser accessed and discarded ancillary NBA career cells on mixed tables that could include held-out players. The audited record states that these values were not displayed, exported, analyzed, or used for fitting. Nevertheless, the event violated the intended source-access boundary and remains a QA failure. Selective cell parsing and regression checks were added and the feature exports regenerated. The incident prevents an unqualified claim of perfect outcome isolation; saving a model after the event cannot erase it.
These disclosures matter because temporal controls address different failure modes. Fold-local imputation prevents statistical leakage through preprocessing. Archived price dates establish that a market observation predates play. Prediction hashes preserve a fixed evaluation. None of those controls proves that every historical predictor was available in the intended form before its season, or that earlier human and parser exposure was impossible.
Discussion and limitations
The main empirical distinction is between predicting production and identifying underpricing. NBA draft position contains substantial information about first-season production, and the richer model's point estimates improve modestly on that baseline. Yet the one-class paired intervals remain wide. The price analyses ask a different question and provide no corrected draft-day bargain rule. A useful production model could still fail to find value if market prices already reflect its information; conversely, an imperfect forecaster could identify value if prices systematically miss a relevant signal. This study establishes neither claim.
Several limitations constrain the negative results. First, only ten historical classes have accepted ESPN prices, and their 138 priced players are selected by source coverage and market participation. Second, the concentration of prices near 140 can dominate apparent returns; the small ADP-below-139 subset changes descriptive conclusions without proving that either subset is unbiased. Third, NBA season totals and default points weights may not match the formats, schedules, or draft practices underlying the ADP pool. Fourth, the prior-season curve is an interpretable benchmark, not a model of risk preferences, replacements, or expected draft utility. Fifth, no matched-veteran control isolates a rookie-specific discount.
The model evidence has separate limitations. Missing training outcomes cluster among late picks. College and combine coverage vary by pathway. Team context is reconstructed differently across historical and test players. The original class-level validation reuses classes for candidate selection and is not chronological rolling validation. A single later class cannot reveal variability across future cohorts, and player-bootstrap intervals may understate uncertainty when players share team or class conditions. The saved 500-draw intervals are comparatively coarse. Posthoc source exploration and feature choice further reduce confirmatory strength. Failure to reject is therefore not proof of no effect, no useful feature, or market efficiency.
A stronger next study would freeze dated preseason rosters, minutes projections, injury status, and actual market observations before a new season; evaluate complete later classes without repeated feature selection; and predeclare how draft-length effects and missing prices are handled. Historical development should use genuinely dated team assignments and rolling class splits as sensitivity analyses. A matched-veteran design could distinguish rookie-specific pricing from benchmark miscalibration. None of these proposed analyses was carried out for this paper, and no 2026-class forecast is reported.
Conclusion
The frozen production model's 2025 error was lower than the draft-position baseline's point estimate, but uncertainty leaves the improvement unresolved. Verified 2025 ESPN prices do not establish average rookie underpricing, and no historical trait survives the 96-comparison correction. The later pick-and-assists model is an exploratory, uncertain simplification. The appropriate conclusion is a bounded one: this retrospective evidence does not yet justify a general rookie bargain rule. Prospective market and role data are needed before translating these patterns into draft recommendations.
Data and reproducibility statement
This working paper is self-published and has not been peer reviewed. Its companion portfolio page provides the 59-player prediction table, downloadable derived data, and a public research audit. The standalone LaTeX source, web text, PDF, and publication manifest accompany this version. The public package contains derived research outputs; raw scraped pages, private session data, and third-party source caches are not redistributed. The full acquisition cache and development environment are not included in the public package, so the public downloads support inspection and result-level checks rather than a claim of complete end-to-end reproducibility.
The local research workflow stores the frozen model specification and prediction locks, original evaluation results, the historical 96-test table, source corrections, and independent audit records. Completed workflow commands validate artifact hashes and return saved runs. The publication builder reads these artifacts without retuning or overwriting them. A public manifest identifies source hashes and the original model lock. The publication date uses America/New_York; source-table and archive dates retain their documented provider or UTC conventions, which can differ by one calendar day.
AI assistance was used to draft, organize, format, and cross-check this manuscript against the saved project artifacts. This disclosure is not a claim of external review or independent replication. The underlying limitations, including the parser incident and withdrawn source interpretation, remain part of the published record.
Appendix: analysis status and implementation details
| Analysis | Population | Status |
|---|---|---|
| Original M3 vs. M0 | 59 picks in 2025 | Retrospective frozen test; parser and timing limits |
| Direct ESPN price test | 19 priced 2025 picks | Post-test exploratory analysis |
| Historical trait screen | 138 prices, 10 classes | 96 planned exploratory comparisons |
| Pick + assists follow-up | 59 picks in 2025 | Posthoc feature choice; training-only fitting |
The original tuning grids were: M0 ridge alpha {0.1, 10, 100}; M1 alpha {1, 30, 300}; M2 alpha {10, 50, 150} crossed with L1 ratio {0.2, 0.8}; and M3 leaf nodes {7, 15} crossed with L2 regularization {0, 10}. The original random seed was 20261002. The later two-predictor bootstrap uses seed 20261005 and 10,000 draws. Hyperparameter-selection scores are development statistics, not independent estimates for the selected two-predictor configuration.
Companion artifacts distinguish the original spline baseline from the later log-linear pick baseline, native points from reference-scale points, and missing observations from verified zero production. These distinctions should be retained when quoting the results. Citation: Xue, R. (2026). Predicting NBA Rookie Fantasy Production and Evaluating Preseason Prices: A Retrospective Study of the 2010–2025 Draft Classes. Working paper, version 1.0, October 5. Published at ryderxue.com.
References
- ESPN (2020). ESPN Fantasy's new default points-league scoring explained. November 11. Archived May 4, 2021. Source.
- National Basketball Association. NBA Stats: Draft History and traditional player statistics. Source records retained with the study's collection manifests. Source.
- Hashtag Basketball (2025). Fantasy basketball average draft position. Table updated October 7, 2025; Internet Archive capture October 9, 2025, 17:39:43 UTC. Source.
- ESPN (2017). Fantasy basketball live draft results: AVG PICK. Internet Archive capture October 16, 2017, 11:29:21 UTC. Representative historical source; all accepted class dates are listed in Table 1. Source.
- Hoerl, A. E., and Kennard, R. W. (1970). Ridge regression: Biased estimation for nonorthogonal problems. Technometrics, 12(1), 55–67. Source.
- Zou, H., and Hastie, T. (2005). Regularization and variable selection via the elastic net. Journal of the Royal Statistical Society: Series B, 67(2), 301–320. Source.
- Friedman, J. H. (2001). Greedy function approximation: A gradient boosting machine. Annals of Statistics, 29(5), 1189–1232. Source.
- Cawley, G. C., and Talbot, N. L. C. (2010). On over-fitting in model selection and subsequent selection bias in performance evaluation. Journal of Machine Learning Research, 11, 2079–2107. Source.
- Efron, B. (1979). Bootstrap methods: Another look at the jackknife. Annals of Statistics, 7(1), 1–26. Source.
- Benjamini, Y., and Hochberg, Y. (1995). Controlling the false discovery rate: A practical and powerful approach to multiple testing. Journal of the Royal Statistical Society: Series B, 57(1), 289–300. Source.
- Phipson, B., and Smyth, G. K. (2010). Permutation p-values should never be zero: Calculating exact p-values when permutations are randomly drawn. Statistical Applications in Genetics and Molecular Biology, 9(1), Article 39. Source.